


Stop me if you have heard this from your users before;
“Skype is crap”
“It just dropped out”
“It sounded like it was breaking up”

Heard it before? Good. That proves your listening. Because even in a perfect environment these issues are going to appear. Mainly because you’re going to peer with customers or mobile phone networks or users working from home or any number of things that are outside your control.
Unfortunately because Skype and Teams rely so heavily on your networking infrastructure that as soon as it suffers in the slightest your UC users will be the first to make noise regardless of what UC platform you choose.
Now, I hear you. You say “I’ve got QoS, that shouldn’t be an issue!” and sure, that’s supposed to be the case.
The amount of times, I’ve proven to customers that their QoS config isn’t setup correctly or that despite the QoS tags being set on the packets them not being honoured is ridiculous. Only for the networking team to point at graphs and say “That link isn’t even at full utilisation” or the more hilarious one. “We don’t need QoS as our links are never contended!” – Seriously, if you say this to me with any amount of gusto I’ll make it my mission to find packet loss.
Trust me, I’ve been on the opposite side of the coin. I’ve been the networking guy looking at RRD and SNMP graphs saying at an ISP saying flatly to my customers “I shouldn’t be dropping any packets” But when you test the workflow with something like IPerf or iR’s UC Assessor you will see packet loss.
What gives?
We as humans are terrible at understanding how networking actually works. We see network links as a pipe.. A pipe that carries water (data) when that’s not actually how network links work at all.

The truth is that network links are more like a conveyor belt with buckets (frames) on it. And whatever appliance (router/switch) you’re sending data too has to fill those buckets with data (packets). it can only do that one thing at a time, regardless of how fast it is. It just so happens that it typically happens so fast we can think of it like a pipe.
Using this analogy we can sorta see where the issues come in. You send data to the router or switch and it places it in a queue after routing it to an appropriate interface. The idea of QoS marks is that your data should always sit at the top of that queue.
So when an empty bucket arrives at the interface (the interface can send a frame) we fill it with higher QoS’ed data than lower marked data first.
If we are not using a properly configured QoS capable router or switch, when that device can send a frame the it will select packets typically in a FIFO (first in, first out) fashion or maybe a Fair Weighted round robin fashion.

The point is we don’t get any sort of priority.
I can hear the keyboard warriors screaming already; “But if the link isn’t contended. All the data will get through anyway!”
I’m sorry but that’s just wrong. Sure, If we can send data quicker than we can receive it we should never have an issue. But that’s in an idea world and we all know an ideal world doesn’t exist.
Now I’ll wait for all the network engineers in the room to point me at their MRTG graphs “see, SEE! Not contended!” and that their network is perfect for voice.
Yeah okay, that table suggests the link never drops packets, but it’s rarely true.
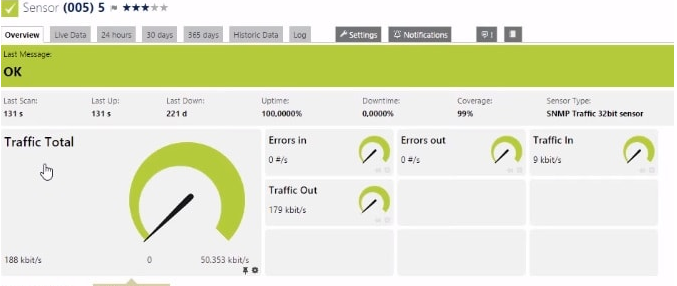
It would be better to look at an MRTG graph of “Discarded Packets” or maybe even SmokePing to see what the interface is actually doing.
(I love this tool.. Tobi, if I could I’d marry you…)
Here’s the rub.
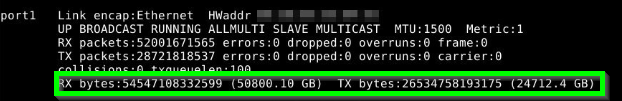
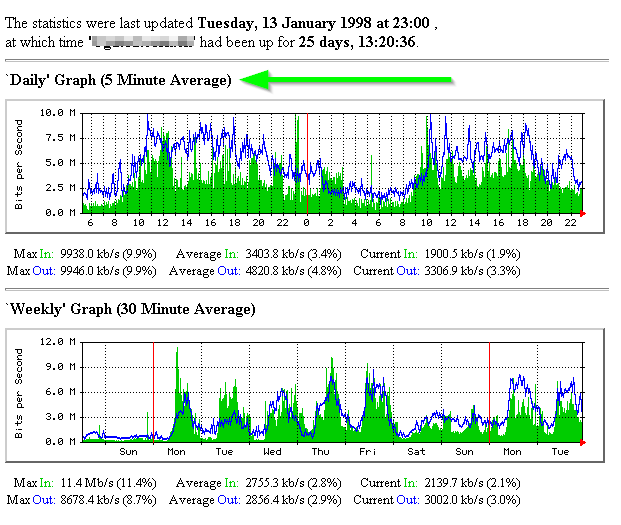
Most of these tools generate these graphs by querying the interface in question via SNMP for the “Bytes Transmitted” and “Bytes Received” counters. And if you’re sensible, you’re only querying the appliance every 5 minutes or so. MRTG and other traffic graphing tools then take the two most recent traffic counts to get the total packets over the sample period, then divide it by time to get the average bytes per second over that sample period.
Believe it or not, this is how your GPS and even your car measure speed. The sampling speed is just considerably higher (Unless its really really old, then theirs a weird mechanical thing I’m not going into here.)
So what does that mean?
That means your MRTG graph doesn’t show what happened during those 5 minutes, only that an average of how many bytes a second occurred. It has no idea if at the start of the 5 minute window you were maxing the link out for 40 seconds then dropped to a reasonable level again. Only that the average was 50mbps. MRTG used to call this out really well with the big “5 Minute Average” text, but no-one pays any attention to that. (Don’t even get me started on 95th percentile or when RRD rounds these down)
Too bad that thanks to that sudden influx of traffic, some of your real-time UC traffic was discarded as the buffer on the switch overflowed.
This gives your users a poor experience, meanwhile the networking team are running around saying “Not the network”
What’s the point then?
Traffic graphs are great. I’ve used them countless times, but they are just an indicative tool. Not a troubleshooting benchmark. Not a substitute for QoS. The only real way to know your network is ready for unified comms workloads it to TEST IT with real traffic. A ping doesnt cut it either! Make sure QoS markings make it from one end to the other and that switches / routers honour the QoS polices you set by checking those queue counters.
Testing isn’t even that hard these days, for Office365 and Teams. Microsoft, IR and fellow MVP James Cussen all offer free tools that use the Office365 media endpoints to test. Which is great for testing your network edge is up to snuff for a hosted PBX solution.
Still On-Prem? That’s fine. IPerf is still around (iperf -c 10.110.10.10 -i 1 -u -b 5000K -r -S 0x2E) or maybe SIPp. Otherwise UC Assessor from IR is a good option if you’re not a networking guy.
So the take away is this. Stop looking at traffic graphs for troubleshooting and network assessment purposes. Test it properly or suffer the pain later.

95 percentile is not a good validation, especially if you are running your synthetic transactions for an extended period of time. Using the Microsoft Network Assessment Tool and then visualizing the result in PowerBI lets you see which time of day your spikes are and also allows you to drill down and look at a smaller time frame. Earlier this year I ran an assessment on a brand new circuit with no traffic on it. Tests came back as PASS, but when visualizing in PowerBI I noticed a small amount of packet drops, but on a brand new circuit with no traffi, there shouldn’t be any at all. I now had objective evidence I could take to the carrier for them to fix. I typically start with the free Microsoft tool and if I see anything out of the ordinary in my PowerBI visualization, I will do an assessment using IR UC Assessor with the Path Insight tool.
You sound like a tool that no matter which job you have you throw your problems over the fence.
Yeah its “the network”. When teams or skype performs like garbage on every network on or off prem. On any provider. With or without vpn. Its teams. Because all other applications work. Or in the case of competing apps: work better. Stick your fingers in your ears or shriek into the void. You’re wrong.
Hi Jimmy,
Thanks for the input. It’s great to see different perspectives on the blog, so thankyou.
I’d like to think this article goes into considerable detail as to “why” I feel what I do above, and its backed by several different vendors and their own Voice Platforms. Open any Cisco Voice book from the 00’s and they will have entire chapters on why the network must be paramount.
For context I was rolling out OpenSIP at an ISP 15 years ago over satellite and spent months investigating the disparity between MRTG graphs and call quality to improve the quality of VoIP over satellite for my customers. Since then I’ve done everything from Cisco Voice, Asterisk, SwitchVox, Lync and now Skype and Teams and the one thing they all share in common is the need for a well maintained network.
It was easy “in the old days” as phones sat on their own vlans, but now with softphones and more workloads is gets a bit muddier.
There are always “other ways” of solving problems, like increasing jitter buffer or adding additional Forward Error Correction. But these usually have trade offs. MS has been pretty big on making a new codec (SATIN) to work in even the lowest of bandwidths with rediculous amounts of packetloss. So only time will tell.